
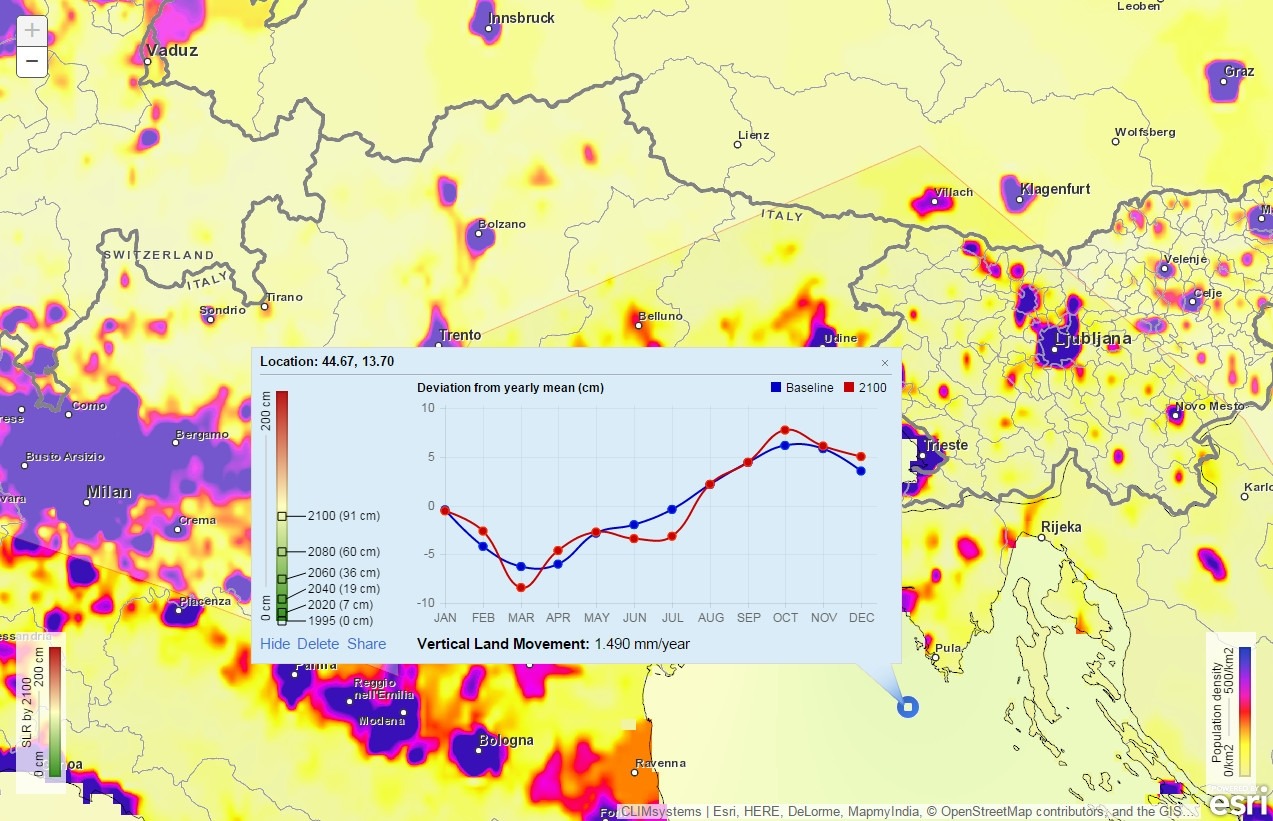
This web application comprehensively displays coastal vulnerabilities through display alongside population density data. Users can obtain detailed information panels and graphs based upon locations they decide. The base map depicts the projected sea level rise for the world's oceans in 2100 from a baseline in 1995 which range from 0 to 200cm (colours in the left-hand legend). The map also shows the population densities around the world scaled for a range of 0-500 persons/km2 (colours in the right-hand legend), so vulnerable cities in coastal areas are easy to spot.
The projection for sea level rise is based on the Fifth Assessment Report of the IPCC and shows the results of an ensemble of 28 General Circulation Models (GCMs) using the greenhouse gas emissions from the Representative Concentration Pathway (RCP) 8.5 under a high climate sensitivity. All the sea level data has been processed following Intergovernmental Panel on Climate Change (IPCC) guidelines. It also takes local vertical land movement into account.
Back